Date
Description
Image
A downloadable version of this explainer is available here:
Document
Concept maps are visualizations drawn to organize and represent knowledge. Researchers often call them mental maps because they reflect the map creator’s understanding of a problem. When teams of people create a shared mental map or model, they need a collaborative process to develop one that all members agree upon. In these maps, the “concepts” (also called, components) usually reside in boxes or circles with interconnecting lines that illustrate the relationships (sometimes called links or flows) between them. A line with an arrow indicates that one component influences or causes a change in another; the arrow’s orientation specifies the direction of influence (“causality”). Often, phrases or +/- signs appear on the lines to indicate how two components relate to one another or interact, i.e., if there is a positive (+) effect or an inverse (-) effect (Figure 1). Sometimes, maps will use a small sphere instead of the negative sign. If there is a line with no arrowhead or sign, it indicates there is a relationship, but how they are related is unknown.
Image

Representing Feedbacks
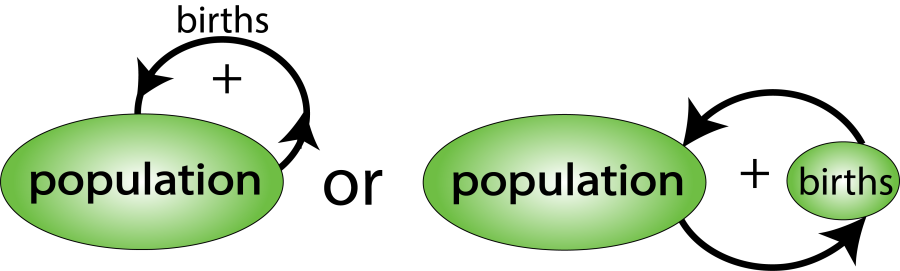
If links or flows in a system are routed back as inputs to the component they started from, this is a feedback. When a flow from a component routes directly back to itself (i.e., not through another component), this is a self-reinforcing feedback. An example is the relationship between population size and birth rate. A population’s number of births leads to a larger population, which in turn leads to more births! (See Figure 2.) Another example is a bank account that earns interest based on the amount in the account. The more you deposit, the more return you get from interest, and the more your account grows.
Image
Sometimes, a feedback passes through a chain of events in other parts of the system before coming back to the component that initiated the chain—i.e., these feedbacks involve other system components (Figure 3). A good example is when food supply determines birth rate. If food is unlimited, then that extra food increases births, and so, the loop is reinforcing (Figure 3a). However, if the increase in births causes food to become limited, death rate increases, which stabilizes the population size (Figure 3b).
Image
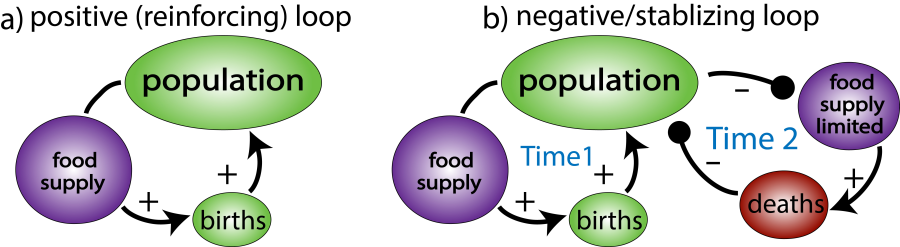
A positive feedback (loop) occurs when a feedback amplifies the effect of a flow, as in Figure 2 and Figure 3a. From a social perspective, “positive” refers to the effects of the feedback (the behavior of the system) and not something that is “good” or “bad” from a human perspective. In fact, the cause of many serious socio-environmental (S-E) problems are positive feedbacks—examples of which we provide below in the last section. When a feedback helps a component return to its former state, it is called a negative or stabilizing feedback loop (Figure 3b). To determine whether a loop is positive or negative over all, consider all relationships in the loop.
For 3a: [no effect] [+] [+] = +
For 3b, births are countered by increases in deaths due to low food: [+] [-] = -
Do not confuse negative interactions with a negative feedback; the former simply refers to one component causing a decrease in the second. We have used a sphere at the end of the line when a component causes another one to decrease. Some people use dashed lines to indicate negative interactions. |
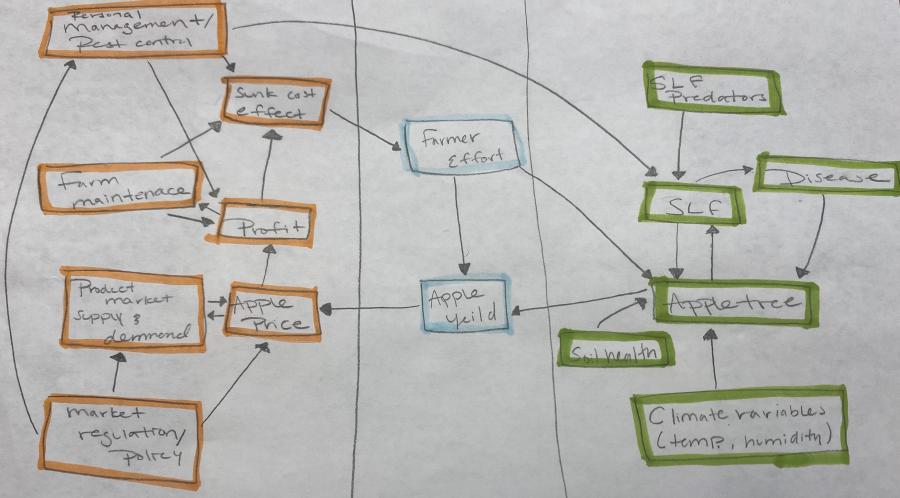
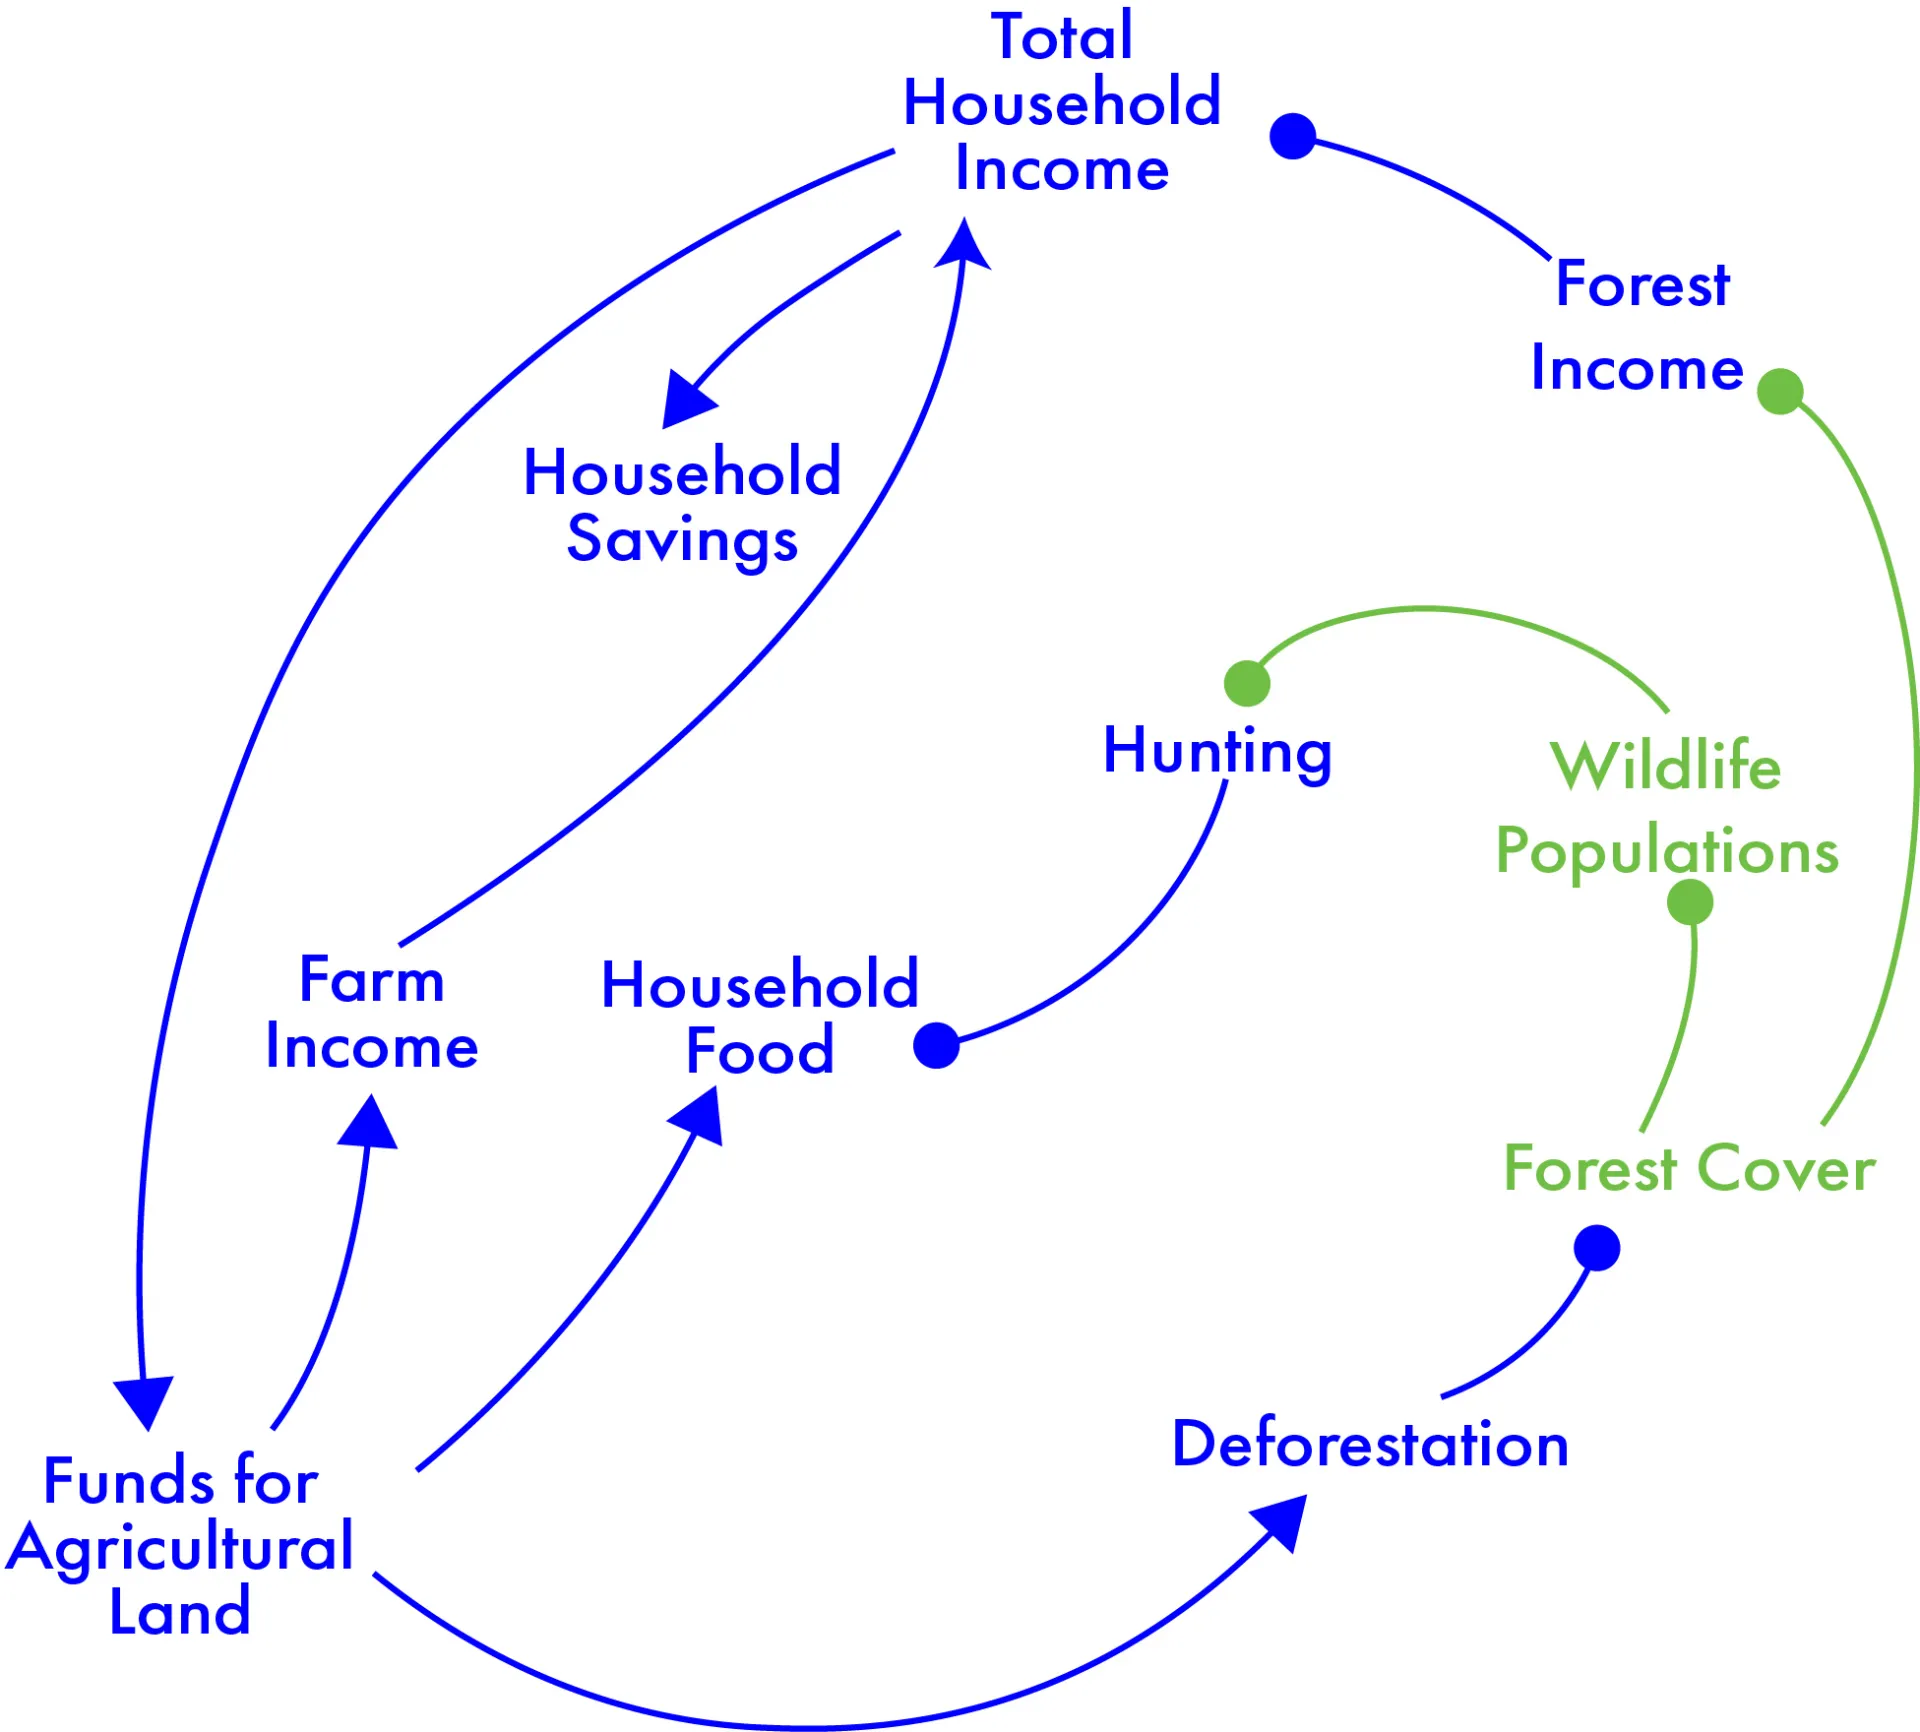
Some people think of concept maps as a type of causal diagram (an illustration that shows cause and effect) because they depict the drivers of or paths leading to changes in different components (Figure 4). Scientists have used causal diagrams for a long time, but they are best for studying problems associated with simple systems, not problems that can arise along multiple paths.
Image
Socio-Environmental Examples
Like many systems—physical, social, environmental—a S-E system changes over time and is thus called a dynamical system. In some cases, systems also change in space. For S-E problems, there are typically many components, many interactions, and many feedbacks in the associated socio-environmental system. S-E systems are an example of complex adaptive systems because they change over time due to the interactions between their components, which can lead to further changes. Sometimes, researchers describe interactions between components mathematically, but doing so can be difficult because there is often a lack of data that can help specify the relationship as an equation or even describe its general shape if graphed (e.g., linear, exponential).
A good example of both positive and negative feedbacks involves research by Zipper et al. (2017), who studied the response of farmers and urban Nebraska residents to drought. In the study, farmers dug many wells, planted more water-intensive crops, and expanded cropland, which led to further decreases in water availability. This type of governance (managing the drought) illustrates a positive feedback loop with negative social consequences. In contrast, urbanites restricted outdoor water use, which resulted in stabilizing the drought problem. I.e., A negative feedback occurred—as water availability declined, water conservation increased, and thus, water availability was no longer a problem, at least during the drought.
Another example of an important feedback loop comes from work by Oliviera et al. (2022). The researchers focused on a coastal city in Brazil that is highly dependent on tourism—especially scuba-diving to see the underwater life. But as tourism increased, so did sewage pollution, which impacts water quality, and thus, sea life. The challenge is to find the right balance between tourism and clean coastal waters—i.e., turn the positive feedback—in which tourism increases pollution excessively—into a balancing feedback, in which policies keep tourism at some reasonable level.
A final example of a S-E causal diagram is one focused on soil carbon management in Australia. In this study, Amin et al (2023) identified 10 feedback loops in grazing lands with high rainfall. Here, many interacting factors influenced the carbon levels, soil quality, and ecosystem health, and these, in turn, influenced the benefits that people experienced, including on income and mental health. However, other factors—such as carbon pricing and monitoring, education, and scientific networks—also influenced them.
References
- Amin, M.N., Lobry de Bruyn, L., Hossain, M.S. et al. (2023). The social-ecological system of farmers’ current soil carbon management in Australian grazing lands. Environmental Management, 72(2), 294–308. https://doi.org/10.1007/s00267-023-01801-4
- Oliveira, B.M., Boumans, R., Fath, B.D. et al. (2022). Socio-ecological systems modelling of coastal urban area under a changing climate–Case study for Ubatuba, Brazil. Ecological Modelling, 468, 109953. https://doi.org/10.1016/j.ecolmodel.2022.109953
- Zipper, S.C., Helm Smith, K., Breyer, B. et al. (2017). Socio-environmental drought response in a mixed urban-agricultural setting: synthesizing biophysical and governance responses in the Platte River Watershed, Nebraska, USA. Ecology and Society 22(4), 39. https://doi.org/10.5751/ES-09549-220439
Share