Date
Overview
Image
A downloadable version of this lesson is available here:
Document
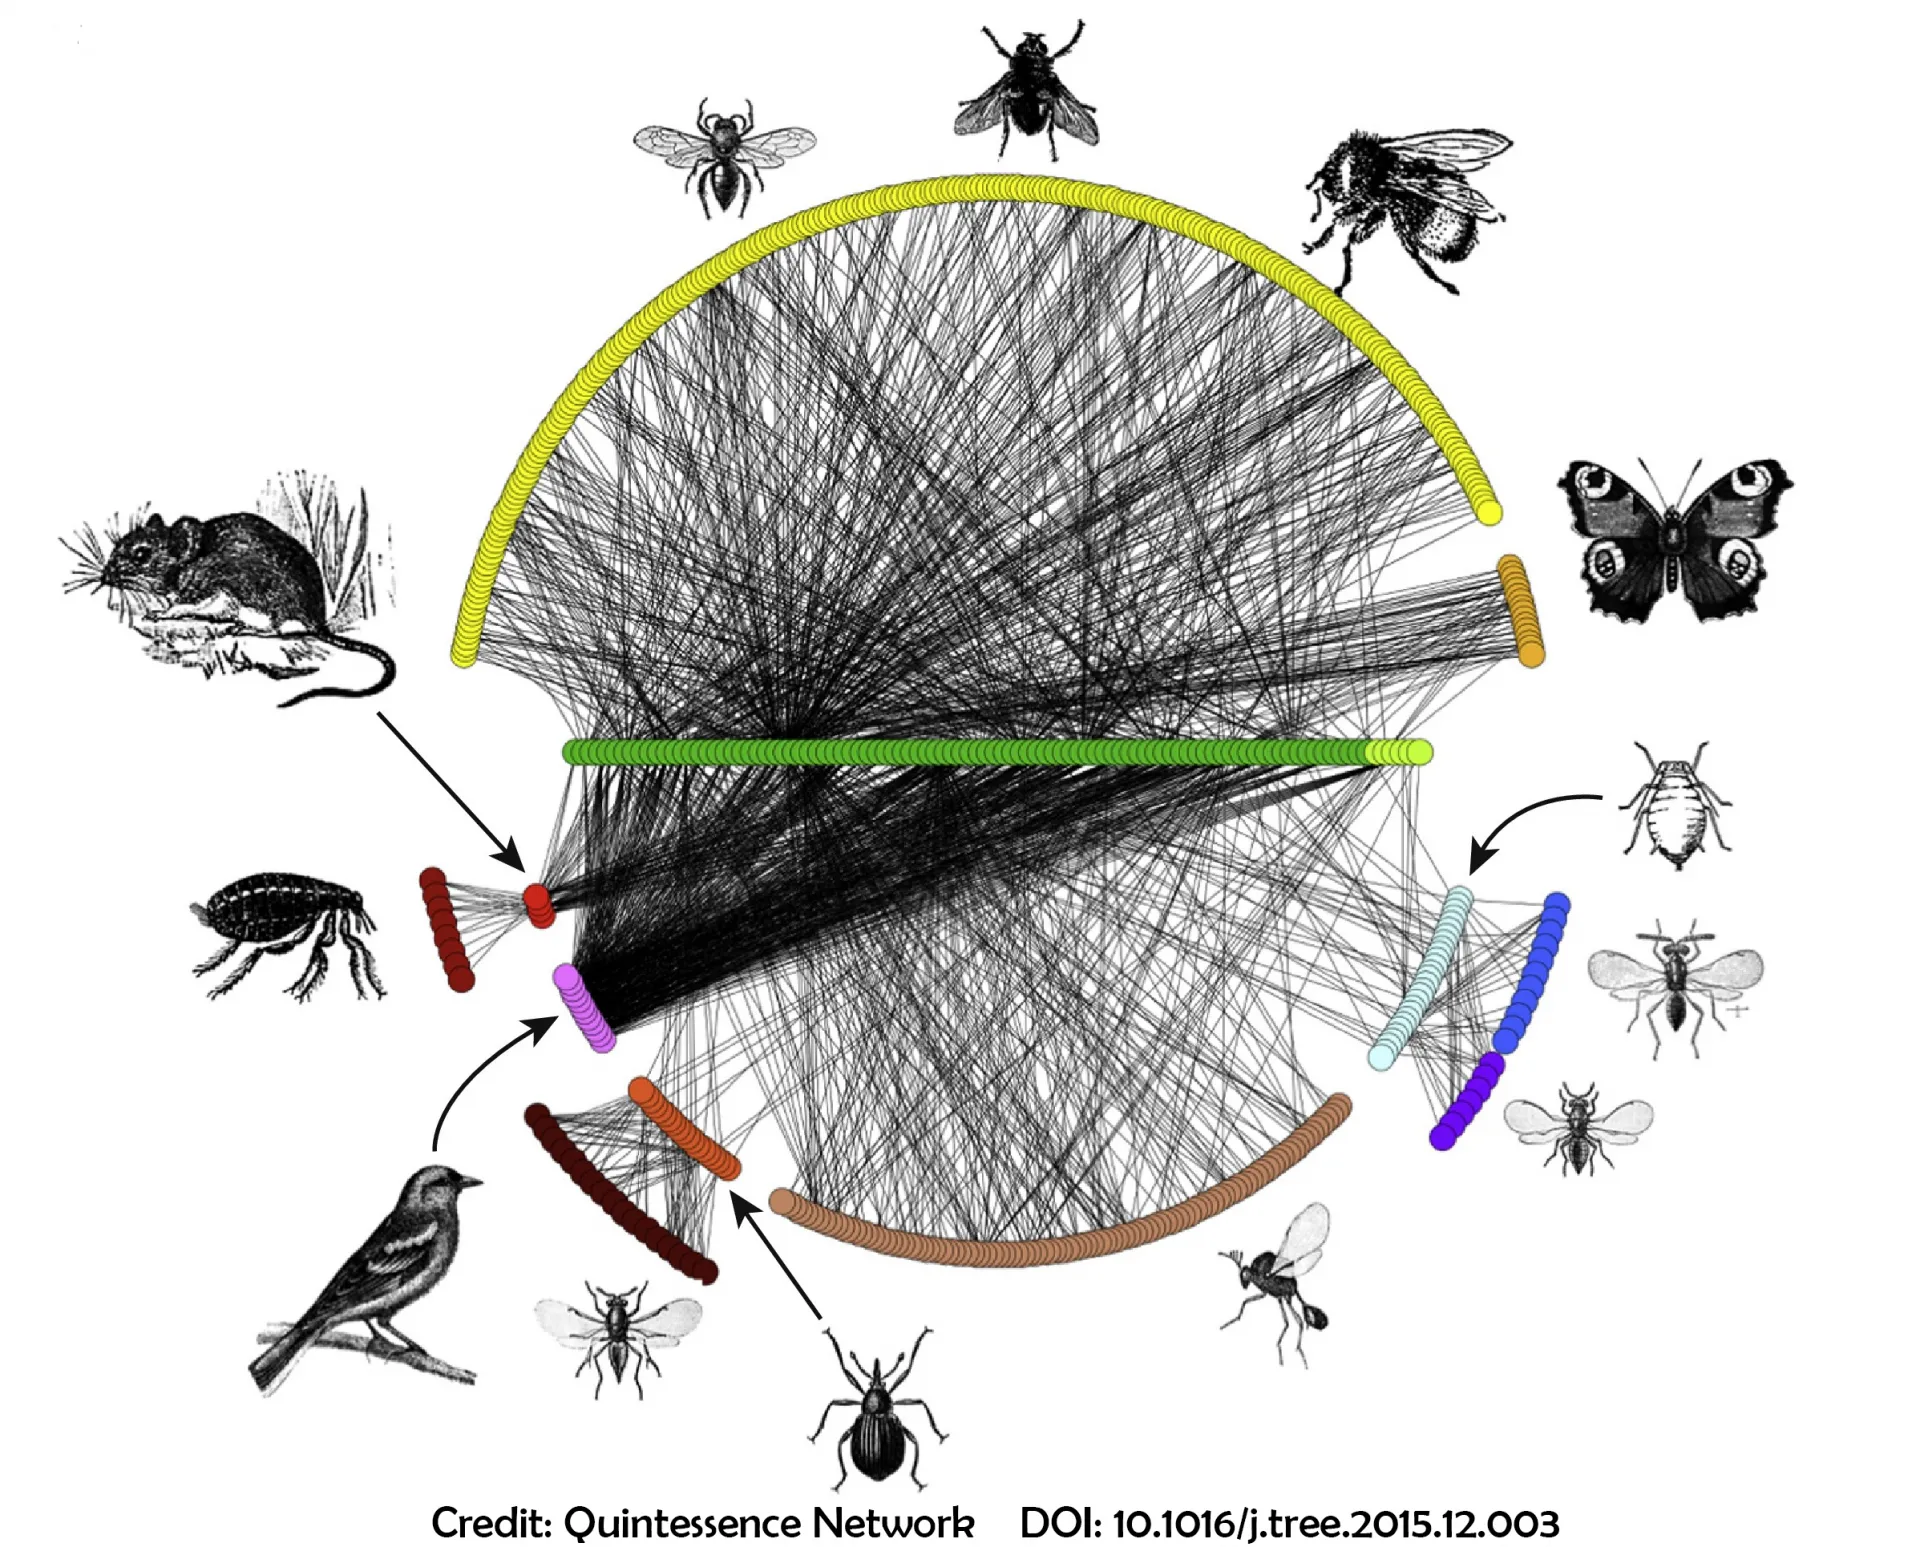
Complex systems are all around us. Whether we are talking about economic, ecological, or social systems, they all comprise components that are connected by interactions that vary in strength and direction. Viewed this way, network diagrams and the science of network analysis are very useful tools for understanding complex systems and how they function. Will more connections result in a system that is overall more stable, i.e., more likely to recover from a disruption? Will loss of one or more components from the system render it overall less robust, i.e., more likely to completely collapse? These are the types of questions that ecologists and social scientists have long asked about the respective systems they study. More recently, environmental scientists from many domains (ecology, hydrology, physical geography, etc.) have joined forces with social scientists (sociologists, anthropologists, archeologists, etc.) to study linked human and natural systems, i.e., socio-environmental systems. Many people are familiar with the concept of a food web as a network of interactions, so in this Part 1 of a three-part lesson, we use ecological systems to introduce basic network concepts. Keystone species is one of many foci.
Assumed Prior Knowledge
Appropriate for undergraduate and more advanced learners with an interest in network and ecological systems theory.
Learning Objectives
- Understand some of the key terms used to describe networks and how measures of network structure (metrics) can reflect emergent properties of networks.
- Apply the concepts of ecological community stability and robustness in the context of networks.
- Apply and understand a specific example in which researchers used network analysis to understand the dynamics of plant-pollinator communities.
- Consider ecological theories and how they can be tested using network approaches.
Key Terms/Concepts
nodes, stability, robustness, node centrality, ecological networks, species interactions, keystone species, specialization, phenology, resource availability, species diversity vs. species richness vs. functional diversity, nestedness, modularity
The “Hook” (suggestions for quickly engaging students)
Image
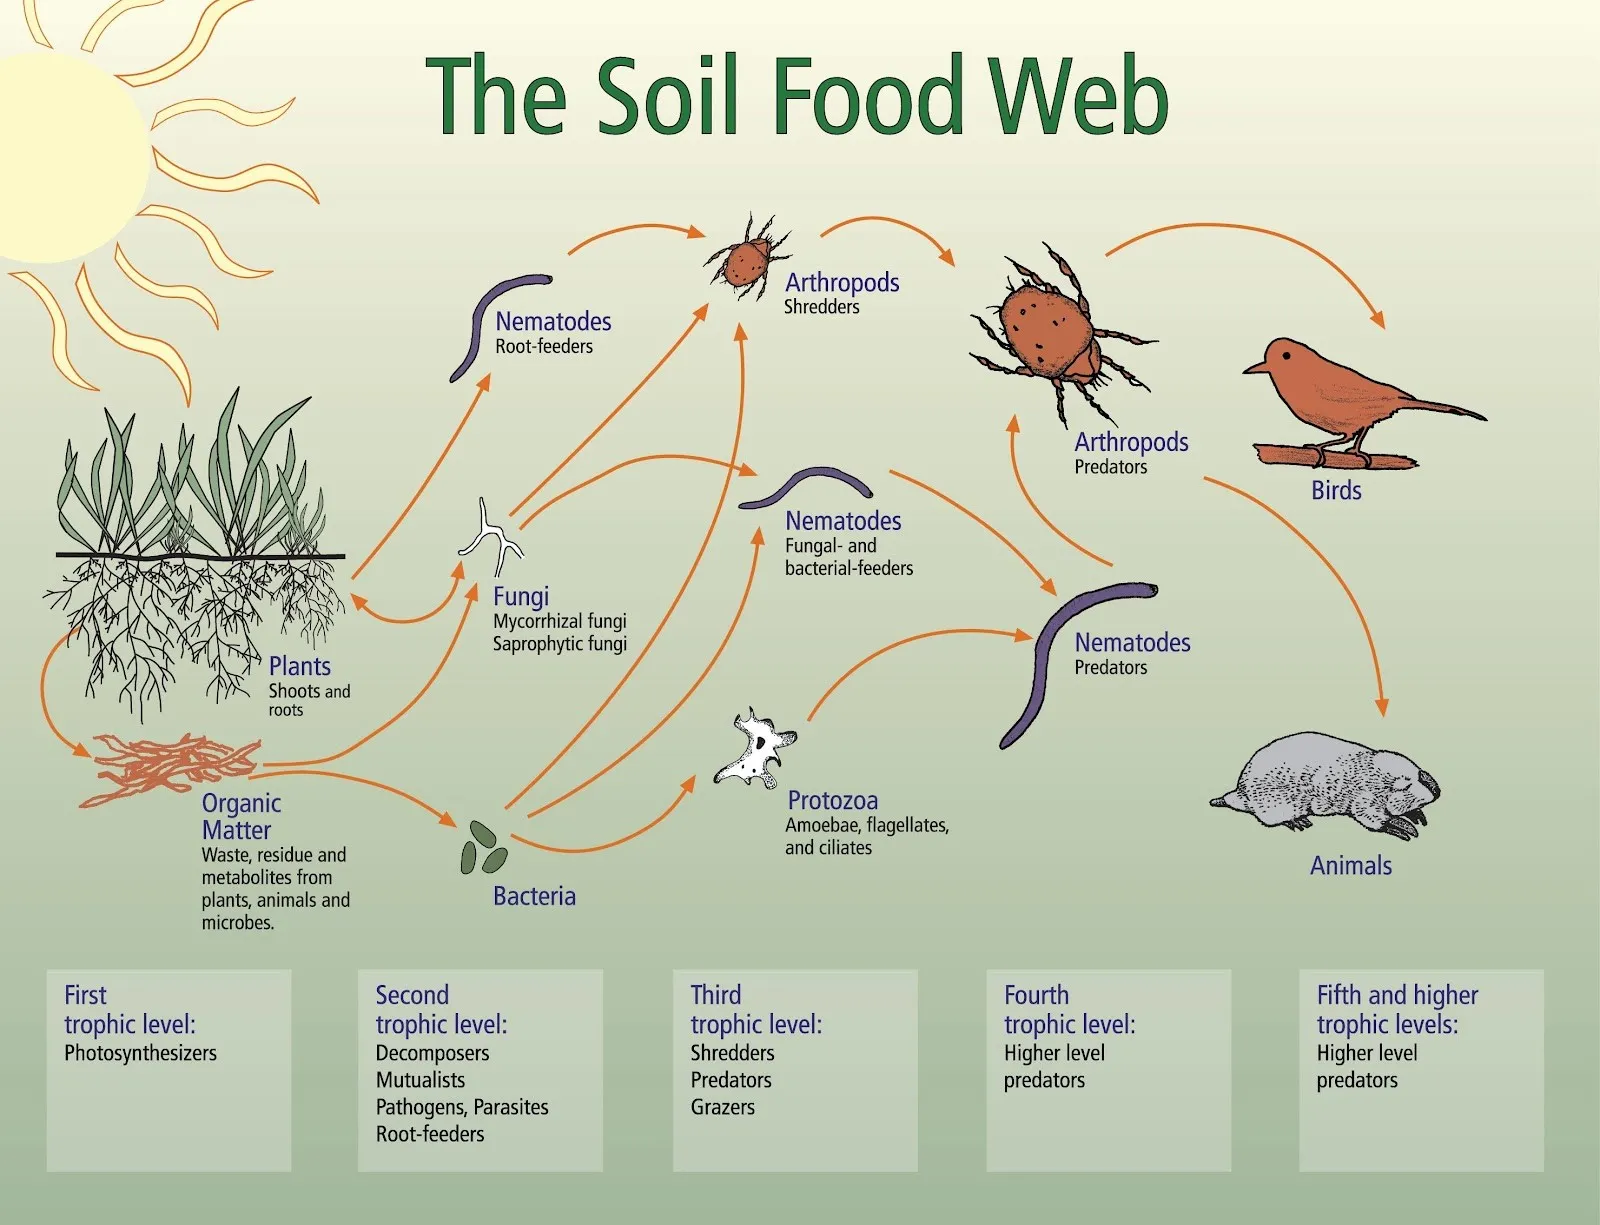
For 3-5 minutes, have participants study the soil food web diagram and critically analyze it for network traits. Do all the arrows flow in one direction from plants to animals via microorganisms and arthropods? How would you close the loop to show the impact of a link between animals (the “end”) and plants (the “start”)? What might happen if the mycorrhizal and saprophytic fungi disappeared? What about birds?
Teaching Assignments
The class session can be for 50 – 75 minutes depending on the instructor’s priorities for the two assignments described below. Suggested time ranges are provided for each. The images in the hook and Figure 1 from the reading used in Assignment 2 of the lesson are in the following PowerPoint.
Document
-
Network Analysis and Ecological Systems (25–35 min.)
Prior to the learning session, have participants watch and take notes on excerpts of Dr. Phillip Staniczenko’s SESYNC video, “Introduction to Ecological Networks.” They may choose to watch the whole 30-min. video, but the content from 10:41–17:10 and 19:17–23:32 is required.
After the hook, use the PowerPoint presentation, “Network Properties: Short Introductory Slides” to provide a very brief introduction to the concept of network properties. Three types of centrality metrics are used to illustrate the concept, and one slide illustrates whole network metrics by focusing on network connectance and network average degree. Prompts for the instructor are provided in the slides’ notes so this can be interactive rather than a one-way flow of information from the instructor to the learners.
Now, have the participants pull up the notes they took on Staniczenko’s video. Ask them to respond to the following questions to facilitate a group discussion. If you prefer, you can give them 5-8 minutes in groups to discuss, then have them post their responses on a document that can be shared with the whole group.
- In a network, why is a species (node) degree less or differentially useful than its average degree?
- Why might the degree distribution for a food web such as that in the hook be informative?
- What is the difference between community (e.g., food web) stability and robustness?
- For advanced learners: if you were interested in the stability of network centrality—specifically, closeness centrality—how might you go about assessing it? If you wanted to do empirical work (and it was ethical), how might you approach this question?
-
Effect of Environmental Variability on Plant-Pollinator Interactions (25–40 min.)
Instructions are provided for undergraduates, as well as more advanced participants. If the group is mixed, divide undergraduates from graduate students and above; additionally, the instructor may wish to ask the advanced participants to present what they discussed after the undergraduates have presented.Prior to class, ask the undergraduates to read the highlighted parts of the paper by Souza et al. 2018 and the short “ecosystems’ descriptions” document. For the advanced participants, instruct them to read the entire paper by Souza et al. 2018 and the short “ecosystems’ descriptions” document.
DocumentHighlighted Souza et al. 2018.pdf (1.25 MB)DocumentSouza Research - Ecosystem Descriptions.pdf (39.77 KB)Split both cohorts (undergrads and grads +) into two or more groups respectively, depending on their size. Instruct half of the groups to focus on the Cerrado and Chaco ecosystems and the other half on the Vereda and Panatal ecosystems.
Instructions for Undergraduate Students:
Have groups spend ~15–25 minutes discussing the following questions, and ask them to summarize their findings to all participants after the breakout session:- Based on your assigned ecosystems and Figure 1 in the Souza paper, do you see differences in the plant-pollinator networks between the rainy and dry seasons? Based on this figure alone, can you tell if there was more specialization during the rainy season? If not, how might you detect such?
- Why have ecologists theorized that specialization may be greater when resources are abundant (speculate as needed)? Given that the authors found the opposite, how might one explain this based on ecological knowledge/theory?
- How might the overall results differ if the work had been done in ecosystems with a temperate climate? Why or why not?
Instructions for Graduate Students and Above:
Have groups spend ~15–25 minutes focusing on the following in addition to what was assigned to undergraduates:- The authors calculated a metric they called “species strength” and “species specialization”—what do each of these mean in the context of this study and how were these metrics useful? (Hint: Do they help explain why the authors found more specialization in the dry season which was counter to their predictions?)
- The authors also calculated a metric they called “network-wide specialization” and “modularity.” What distinguishes these two and how might they be useful in understanding a different type of network—say a social network?
- What ecological research would your group do next if they collaborated with Souza et al. (2018)?
Background Information for the Instructor
-
Delmas, E., M. Besson, M.H. Brice et al. 2019. Analysing ecological networks of species interactions. Biol. Rev. 94(1): 16-36.
These authors provide a review of the tools that have been developed for analyzing ecological networks that they believe are most robust, informative, and ecologically sound. They highlight appropriate uses and potential limitations as well as a classification of methods and metrics by the types of ecological questions they can be used to answer.
-
Baldock et al. 2019. A systems approach reveals urban pollinator hotspots and conservation opportunities. Nature Ecol. Evol. 3:363-373.
This research investigates how urban land use, including gardens and allotments, supports pollinator populations and the ecosystem services they provide. The researchers found more robust pollinator activity in wealthier areas, thus integrating sociological factors with ecosystem dynamics and providing urban planning policy directives.
Share